How A/B Testing Increased My Revenue With 320%
With Split Testing at TubeBuddy, you can upload two thumbnails for your YouTube video. TubeBuddy will show them every other day on autopilot and show you which thumbnail is performing better.

So I did this with a video where I show people how to make a website. In that video i promoted a web hosting company. When people get web hosting through my affiliate link, I make money.
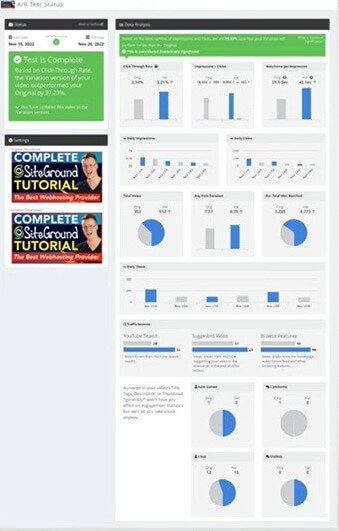
I got a few sales per month. The video was doing ok. When I started using the Split Testing feature at TubeBuddy i found out that adding a simple red line around my Thumbnail increased the click-through rate with 37%. That means that 37% more people where clicking on my video as before.
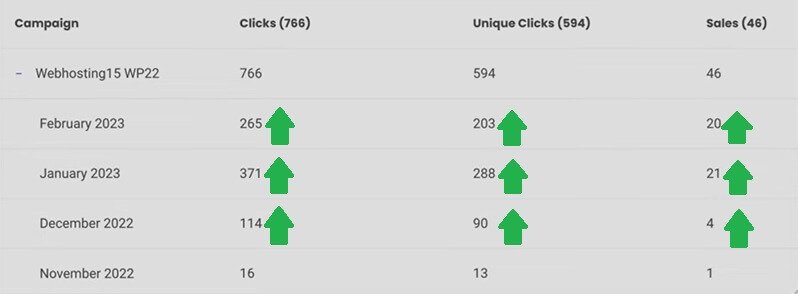
Make you think: How can this give you 320% more revenue when the increase is only37%? Great question. When the Click Through rate of a Video becomes higher, YouTube wants to share the video with more people. So because of the 37% increase in CTR (Click Through) i did not get just 37% more visitors, but i got 400% more visitors to my YouTube Video. And I was able to increase my revenue with 320%.
What is A/B Testing on TubeBuddy? A/B Testing Statistics
Write something
A/B Split testing is the process of selecting two different thumbnails and letting TubeBuddy show each thumbnail every other day. When u do that TubeBuddy keeps track of all the statistics and show you which thumbnail is performing better. These are the statistics TubeBuddy is tracking:
• Click-Trough Rate
• Impressions > Clicks
• Watch Time per Impression
• Daily Impressions
• Daily Clicks
• Total Views
• Avg View Duration
• Estimated Total Minutes Watched
• Daily Views
• YouTube Search Numbers
• Suggested Video Numbers
• Browse Feature Numbers
• Subs Gained
• Comments
• Likes
• Dislikes
With all those statistics TubeBuddy can automatically help us decide which thumbnail is performing better. In the end of the day, it will bring you a higher click-through rate, more views and more exposure on YouTube because videos with a higher click-through rate are shown more often on YouTube.
Which statistics are the most important one?
I know it looks overwhelming and exciting – all those statistics. I focus on tho statistics.
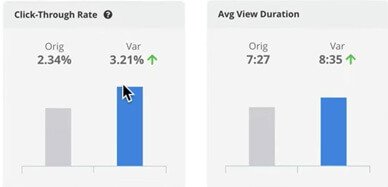
• Click-Trough Rate
• Average View Duration
When those two are better than the original thumbnail, I have a winning thumbnail. Why? For YouTube Click-Through Rate and Average View Time are super important!
Which one is the most important? Average View Duration. YouTube wants to keep the viewer on the platform as long as possible so they can make more money through ads. So if u can let viewers stay on the platform for a longer time, YouTube loves that!
How can a thumbnail increase or decrease the Average View Duration?
If I made a thumbnail that states that people can start making $1.000 per day doing something for 5 minutes, my Click Through Rate would go through the roof. A high percentage would click. But when the viewers would find out it is a video about plants, they would leave the video as soon as they lcik on the video.
When your thumbnail is not in line with your concept, people tend to leave unless the content is better than what the thumbnail seems to tell. So getting a higher click-through rate is not hard. But it can decrease the Average View Duration. When your thumbnail and content of your video are in line, you can increase the Average View Duration.
The best scenario is when your new thumbnail is performing better than the original, and it is increasing the Average View Duration. Then your video can start to perform a lot better as you have seen in the case study above!
What To Do After an A/B Split Test
When u have finished your A/B Split Test u can do a new split test on the winning thumbnail. In that way u can keep making your thumbnail better so it will drive more traffic and let YouTube show your video to more people.
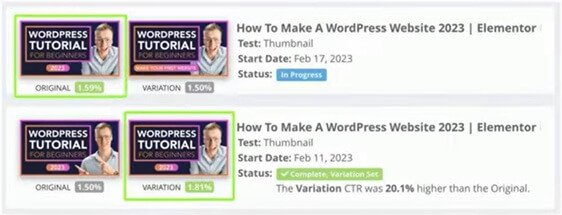
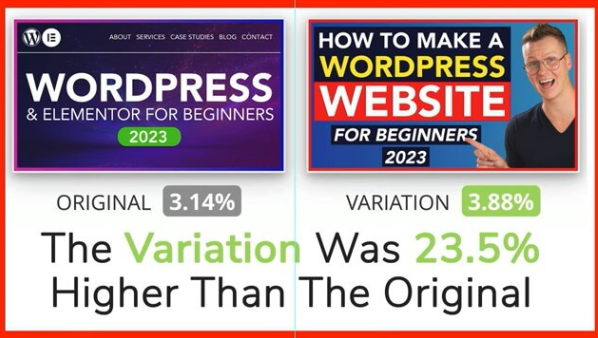
Let me talk about the example u see above. I tried a different profile picture of myself. The left one (below) is a tele shot (zoomed in from a distance). The right one (below) is a close-up image (24mm lens). The thumbnail with the close-up image performs 20 better than the left image.
So I chose this winning thumbnail. But now I tried something else with the winning product. I changed the text in the button from “2023” left above to “Make Your First Website” (right above). TubeBuddy found out that the original with “2023” is performing better. When the Average View Duration of both thumbnails are almost the same I would go with the original image and try something new.
Your goal should be to always have a few A/B Tests in progress. Why? In that way u can keep optimizing your thumbnails, get more views, be shown to a broader audience on YouTube, make more money and grow your channel.
Split Testing your Title, Description and Tags
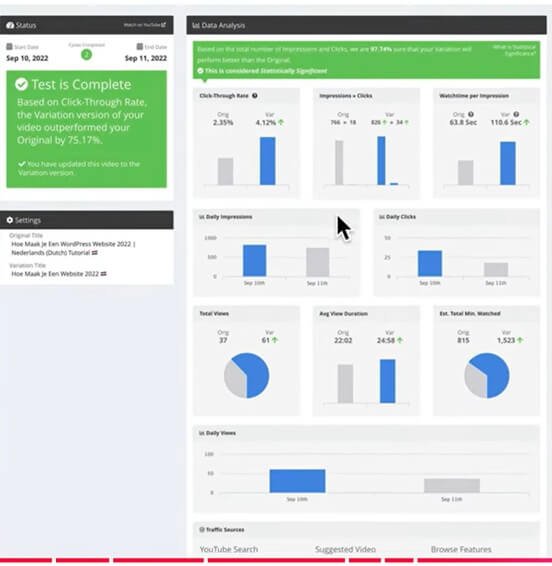
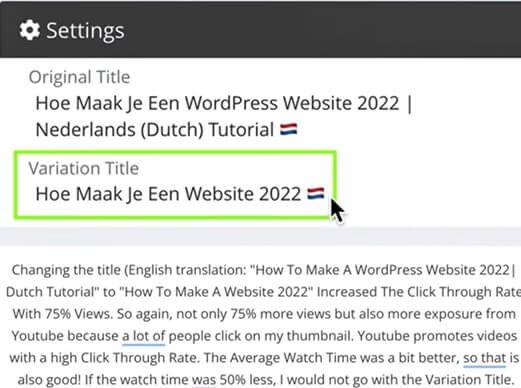
You can even take it a step further. You can not just do an A/B Test on thumbnails, but also on your YouTube video’s Title, Description, and Tags. So you can play around with that and see what is performing better. When you use the same tags as the number one video on your video’s perfect search term, it can be that your video will be suggested more. Let’s show an example.
How To Get Started With Tubebuddy Split Testing
So i hope you are excited and ready to see the results for yourself! So how to get started?
You can sign up for TubeBuddy via the button below.